 Shipping Reports
Monthly Shipping and Marketing Report | July 2023
Council Update
Open Positions on the Council (2024-2026 term):
The ballots are in and are being tabulated. Background forms will be sent out to those that qualify to move forward in the nomination process.
Council Meeting:
The next Council meeting will be held on September 7 in Kennett Square, PA. If you are interested in attending, please let us know so we can be sure you are accommodated.
Annual Industry Meeting
Wednesday, September 6; 4:30-6:00pm ET in Kennett Square, PA
Council Webinars:
See past webinars here: Mushroom Council Industry Member Webinars
Recently Approved Materials
- 2022 Mushroom Council Annual Report
- Animated Allrecipes Banner Ads for Fall
- Sustainability Graphics for Kids
- Blog Post – How to Pack a Picnic with Mushrooms
- Recipe of the Month Newsletter
- Mushrooms in the News:
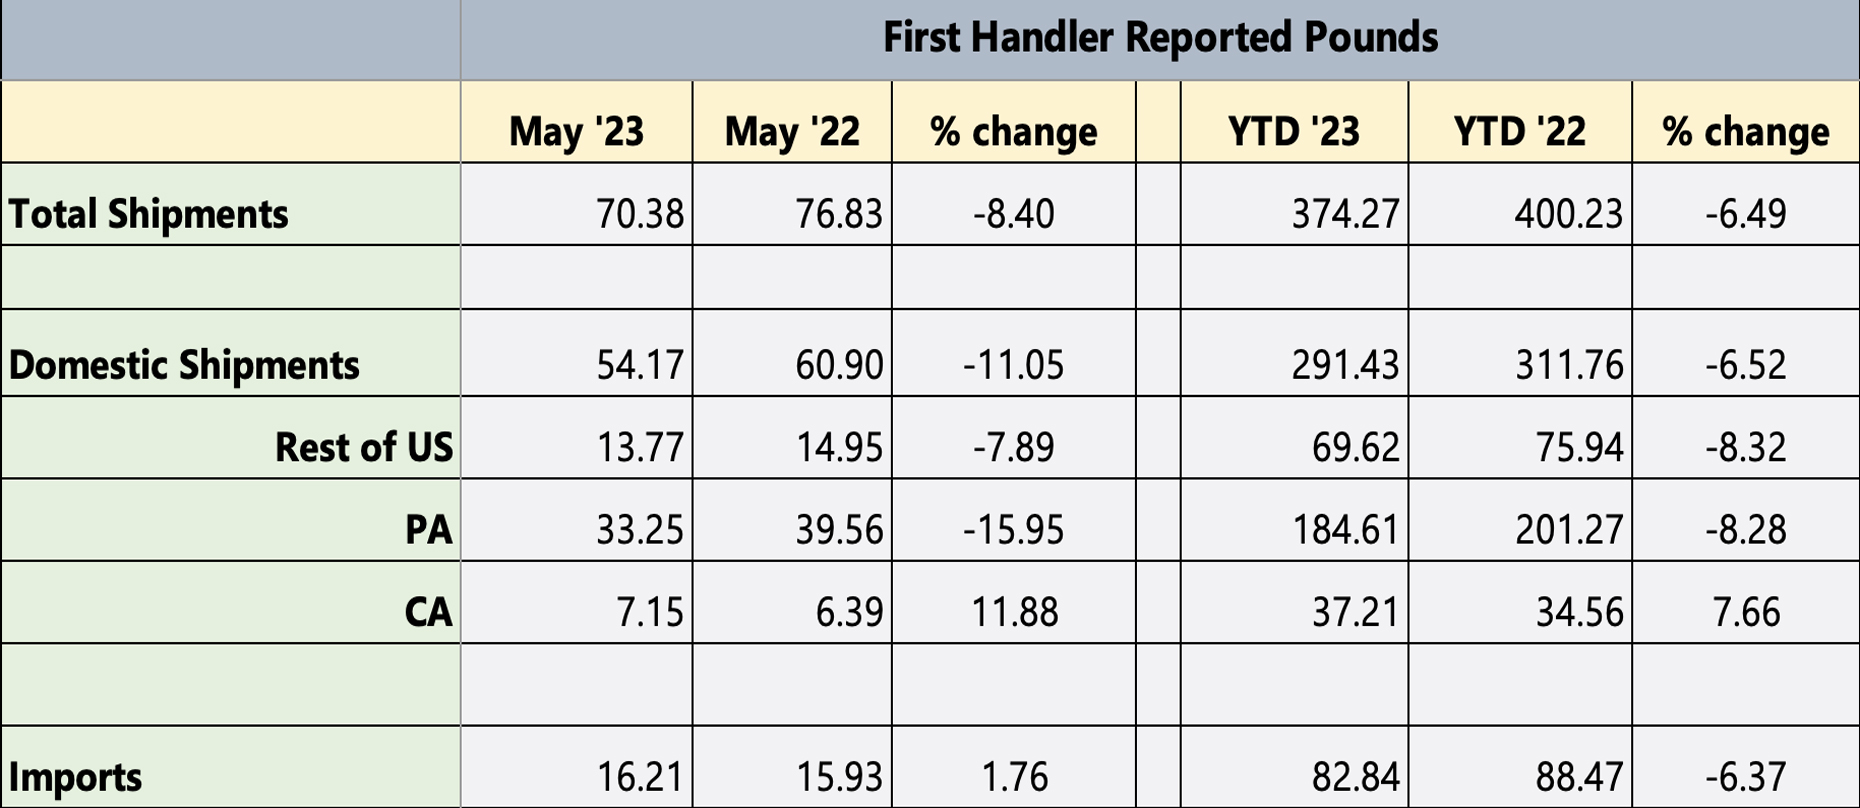
Shipment Summary

Marketing Assets for June

Allrecipes Campaign
Voting for the “Mix It Up with Mushrooms” contest with Allrecipes ends on July 14th.
Download the campaign assets and promote today!
Channel Highlights
CONSUMER
July:
- On July 14, voting for the Mix it Up with Mushrooms contest concludes. Please make the dishes, vote for your favorite and share the contest.
June:
- The Summer2023 Issue of Allrecipes Magazine hit news stands this past week, and mushrooms were present throughout the issue. In May, the Council’s “Mix It Up With Mushrooms” campaign and recipe contest launched online at Allrecipes.com, celebrating how to blend your weeknight meals. The brand’s magazine included a full-page contest feature alongside our ad for The Blend™. The magazine also had additional mushroom editorial content, including a two-page spread highlighting mushroom educational content, and three burger features in a “Best Burgers Ever” round-up (a mushrooms-swiss topped burger, bison/portabella burger and a turkey blended burger).
FOODSERVICE
June:
- Spoke at the CIA Healthy Menus Collaborative about The Blend during a panel on Building a Better Burger attended by foodservice decision makers. Pam Smith starts talking at 39 minutes.
RETAIL
June:
- For an in-depth look at organic fresh produce and mushroom sales at retail see this updated white paper on Organic Mushroom Sales.
INDUSTRY COMMUNICATIONS
- The Mushroom Council commissioned shopper research to determine which messages, statements and slogans are the most impactful on pack, and to understand why. Watch the 15-minute summary of our newest label research.
NUTRITION RESEARCH
July:
- Attend Annual Meeting of the American Society for Nutrition (Nutrition 2023) and monitor presentation of Campbell abstract “What’s in a Mushroom? Dietary Mushroom Metabolomics Profiling Using Untargeted Metabolomics and Targeted Amino Acid Analysis.” Full manuscript anticipated to be submitted by end of June to the journal Foods, an international, scientific, peer-reviewed, open access journal of food science.
- Monitor submission of full manuscript on cardiometabolic component of Campbell research anticipated in July
- Meet with members of the Research Advisory Panel at Nutrition 2023 and monitor scientific presentations relevant to mushrooms.
June:
- Coordinated sourcing and delivery of oyster mushrooms for Williams clinical trial on cognition.
MUSHROOMS IN SCHOOLS
July:
- In July, Mushrooms in Schools will be promoting our Portable Portabella Burger promotion! This will be timely as schools will start menu planning for the new year. Our giveaways for schools and CACFP will occur to increase engagement from these stakeholders as well as gathering wonderful mushrooms recipes. We encourage other channels to amplify Mushrooms in Schools by sharing posts on Facebook and Twitter.
- The Portable Portabella Burger promotion is the showcase of our booth at the School Nutrition Association’s Annual National Conference. Mushrooms in Schools will be at SNA in Denver, Colorado during July 9-11. For more information, please reach out to Malissa Marsden, SchoolMeals@mushroomcouncil.org.
June:
- During June, Mushrooms in Schools started the conversation (and piquing interest) on our new promotion – Portable Portabella Burger promotion. We highlighted resources, recipes, and giveaways around this promotion. Littleton Public Schools Nutrition Services, Pittsburgh Regional Food Service Department, and Everett Public Schools Food & Nutrition Services were highlighted on social media channels.
Marketing Summary

Notable Highlights for May
- Programmatic ads continue to perform well as a driver of quality traffic to the website.
- CTR continues to be outstanding for this channel at.84%, besting the industry benchmark of 0.07%.
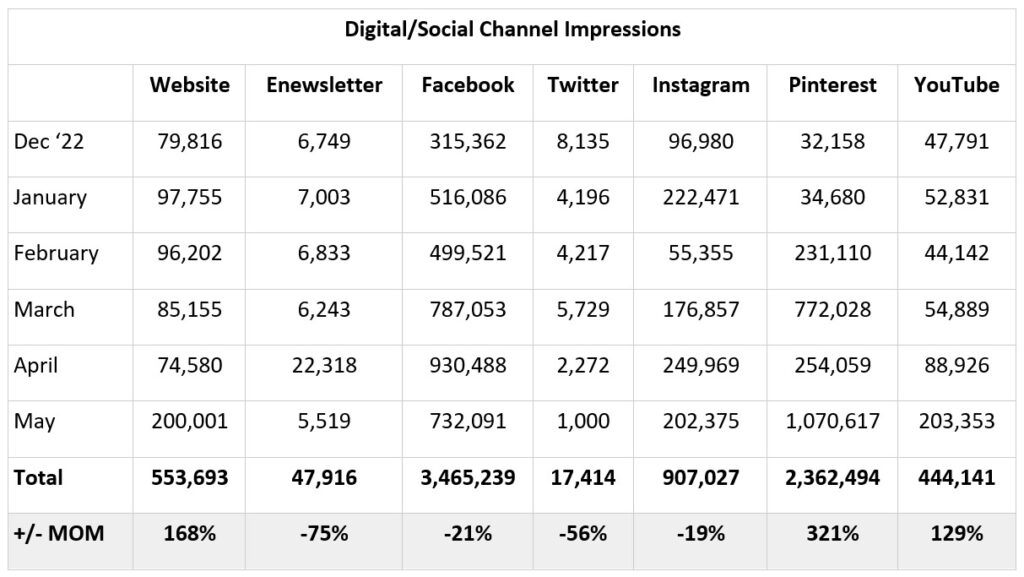
- Website traffic increased considerably from last month, +168%.
- Facebook Paid Impressions are up and Organic impressions are down. This also shows us how important paid is in social, as year over year we see less organic engagement on posts.
- With incredible organic success on Pinterest, we are putting more efforts there, both organic and paid, hence the 321% increase in impressions and 4000%+ in engagements.
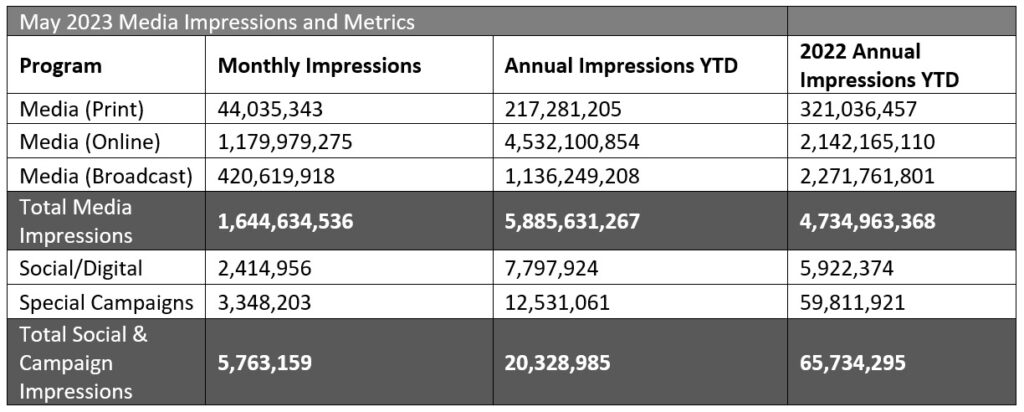
- Special Campaign and Overall Impressions are down from 2022, for several reasons, including a shift away from influencer partners, a shift from Food Network to Allrecipes (different campaigns and tracking), and the competitive digital ad landscape.
- To note, we are shifting efforts away from Twitter with plans to monitor for questions only in the future. Expect to see drops in results on that channel as a result.

| *Youtube engagement metrics have changed. Digital metrics are constantly evolving, so we created our own updated Engagement metrics (comments + shares + likes + dislikes + subscribers lost + subscribers gained) |

Special Campaign Impressions
Includes paid promotions, partnerships and advertising activities.


Previous Month’s Highlights
January
- The relaunch of this year’s FYIS campaign resulted in an influx of impressions and engagments across social channels, in particular Facebook (+64% increase in Impressions and 100% increase in Engagements).
- The FYIS kick-off eblast also prompted hundreds more clicks than the month prior, driving users to the FYIS landing page.
- While social impressions and engagements are tracking YOY, digital ad impressions are down compared to January 2022. This could be due to a lower ad budget this year, ad fatigue (3rd year running) and/or audience targeting changes. We are testing and evaluating ad updates to optimize and maximize our impact through the rest of the campaign.
February
- Overall impressions from the MC social channels dipped compared to last month but remain consistent with results YOY.
- We shifted budget from Instagram and Facebook to Pinterest, which is reflected in the dramatic increase in engagements and impressions.
- Due to the inclusion of the “Feed Your Immune System with Soup” giveaway in the e-newsletter, we saw a 77% increase in clicks. 28% of the total clicks were to the Facebook post, followed by the FYIS Exclusive Recipe Card Download.
- Pinterest impressions and engagements also saw an incredible spike due to reallocation of paid spend on this channel.
- Digital ad results are up from January, but continue to underperform compared to 2021 due to an increase in cost per impression and competition. We’re continuing to test and evaluate updates to help optimize throughout the rest of the campaign – and future campaigns.
March
- While overall Impressions and Engagements remain steady/positive for for MC social channels, we are continuing to see numbers down from last year’s digital ads, which were a huge contributor to Impressions and Clicks to the website. Despite shifts in budget, targeting and creative, we were unable to meet the same impressions we saw last year.
- This is likely contributed to increasing competition: The PPC (Pay Per Click) advertising landscape has become increasingly competitive as more businesses continue to shift/invest in digital ads.
- As we move into new campaigns, we’ll continue to test and optimize digital ads to better understand whether to continue or shift budgets to better performing tactics.
- Despite the decline in digital ads YOY, we are seeing tremendous performance on owned social platforms, specifically Pinterest and Instagram Impressions and Engagements, due to paid spend allocations.
April:
- Although we had a decrease in ad spend on Instagram from last year, we saw an increase of engagements on our posts. One large driver of engagements in April was the post asking users to pick their favorite recipe. This led to 77 comments, 28 shares, 126 saves and 388 likes which were primarily organic.
- On Pinterest our traffic to our website is up significantly from last year. We are going to continue to push this platform and look for ways to optimize our creative and copy to perform even better.
- With the increase to weekly eblast this month, we saw a dramatic increase in enewsletter opens and clicks.
- To note, we are shifting efforts away from Twitter with plans to monitor for questions only in the future. Expect to see drops in results on that channel as a result.
- We ran three different digital ad strategies this month targeting Home Chefs for Earth Month:
- Prospecting: Display (banner ads pointing to MC Earth Month landing page)
- Prospecting: Kittch (banner ads pointing to Kittch streams)
- Prospecting: Pre-Roll (pre-roll ad pointing to Kittch streams)
- Despite lower impressions from last year, the CTR on our digital ads is outstanding, besting the industry benchmark of 0.07%. TheCTR for MC digital ads for this month was .4%, an increase of 35% compared to the previous month.
- Pre-Roll performed great from a brand awareness standpoint, as 87,875 users watched the video in full.
Topline Report
Tracker Highlights – Period ending 06/18/2023
- Download Retail Tracker for Period ending 06/18/2023
- Download Fresh Mushroom Sales Review for Period ending 06/18/2023
- Download Mushroom Retail Performance for Period ending 06/18/2023
The Markeplace
The price per unit across all food and beverages in the Circana-measured universe increased 6.9% versus year ago levels in May 2023, down from 11.4% in the first quarter of the year. However, when compared to May 2020, prices have increased by 23.3% and consumers continue to change up their food decisions to balance their budgets. Above all, they have increased their store trips to chase deals, while buying fewer units.
- In the produce department, the pullback on units has resulted in 1.4% fewer dollars per trip in May 2023 compared to year-ago levels. Product trips were up 1.2%.
- Traditional grocery represented 40.5% of produce dollars in May, down from 42.8% in 2020. Supercenter/ mass now represents 20.2%, up from 17.4% in 2022. Other channels up from their 2022 shares are clubs and online. Specialty grocery stores have dropped from 4.8% to 3.7% of total produce dollars.
- In produce, both vegetables and fruit trended right around year ago levels in May in terms of units. With deflationary conditions in fruit that meant fruit dollars decreased 3.1% versus year ago levels, whereas vegetables increased by 2.0% on mild inflation.
- Per the May Circana survey of primary grocery shoppers, inflation is affecting the summer travel plans of many resulting in fewer/shorter trips and staycations.
- 67% of consumers plan cookouts/barbeque gatherings.
- Across entertaining, everyday and weekend occasions, 50% of consumers plan to grill as much as last summer and 19% plan to grill more. New recipes inspire 34% of consumers to grill more.
Dollars, Units and Volume Performance
For the four weeks ending June 18th 2023, total food and beverage dollar sales increased 3.6% over the quad-week period, but units were down 2.9%. Fresh produce dollar sales were up slightly (+1.1%) and fresh mushroom sales were down 2.4% year-on-year. This data has been adjusted for the supercenter data error.
Fresh mushrooms experienced unit and volume declines during the shorter and longer time periods. In the latest four weeks, volume declines stayed within 3 points of year ago levels. Importantly, volume declines are moderating in comparison with the 52-week look that shows pounds down 6.4%.

Weekly sales for mushrooms averaged between $22.9 million and $23.7 million in each of the four weeks. Sales were slightly higher the week of Memorial Day and the week of Father’s Day, at $23.7 million each — demonstrating that special occasions and holidays still drive slightly higher spending across categories, including mushrooms. The period-over-period sales trends continue to follow long-established patterns (as seen on the forecasting tab). During the summer months, sales tend to decrease quad week over quad-week period, and pounds start to gear back up after the back-to-school season.

Inflation
Inflation in vegetables is moderating and mushrooms are following suit. Mushroom prices per unit increased by 1.2% versus year ago in the latest quad-week period. This is down from 5.8% in the 52-week view.

Moderation in price increases goes hand-in-hand with an increase in promotional activity. During the latest quad-week period 18.8% of total fresh mushroom dollars sold while on promotion. Promotional levels for total fresh produce as well as total food and beverages also increased substantially year-on-year, but were still below the 2020 pre-pandemic levels.

Performance by segment
White mushrooms represented 52.3% of mushroom dollars and 59.4% of pounds in the four-week period. Brown mushrooms, the combination of criminis and portabellas, fared better than white mushrooms, with flat dollar sales versus year ago levels in both dollars and pounds.

Additional observations:
- Package size: 8-ounce packages generated 49.6% of total sales in the four-week period, but dollar sales declined 4.5% versus the same four weeks in 2022. 16-ounce packages represented 23.3% of sales and declined 1.0% in dollars, while also showing a better-than-average unit and volume performance.
- Organic vs. conventional: Organic mushrooms made up 9.9% of pounds and have been an above-average performer. Dollar sales increased 3.0% along with unit growth of 0.7%.
IRI, Integrated Fresh, MULO, YTD and 4 weeks ending 06/18/2023


We collect, use and process your data according to our Privacy Policy.